Your Analytics
An overview of the tuddl Analytic suite

Adrian Preston
Last Update vor 5 Jahren
Tuddl provide a comprehensive suite of analytics to help you understand how your organisation's team wellbeing is progressing over time. Here are a few pointers on getting the best out of it!
Interacting with your Dashboards
Most of the individual analytics in the tuddl platform can be refined to show you the data you need. In general, you can edit your analytics using the following functions:
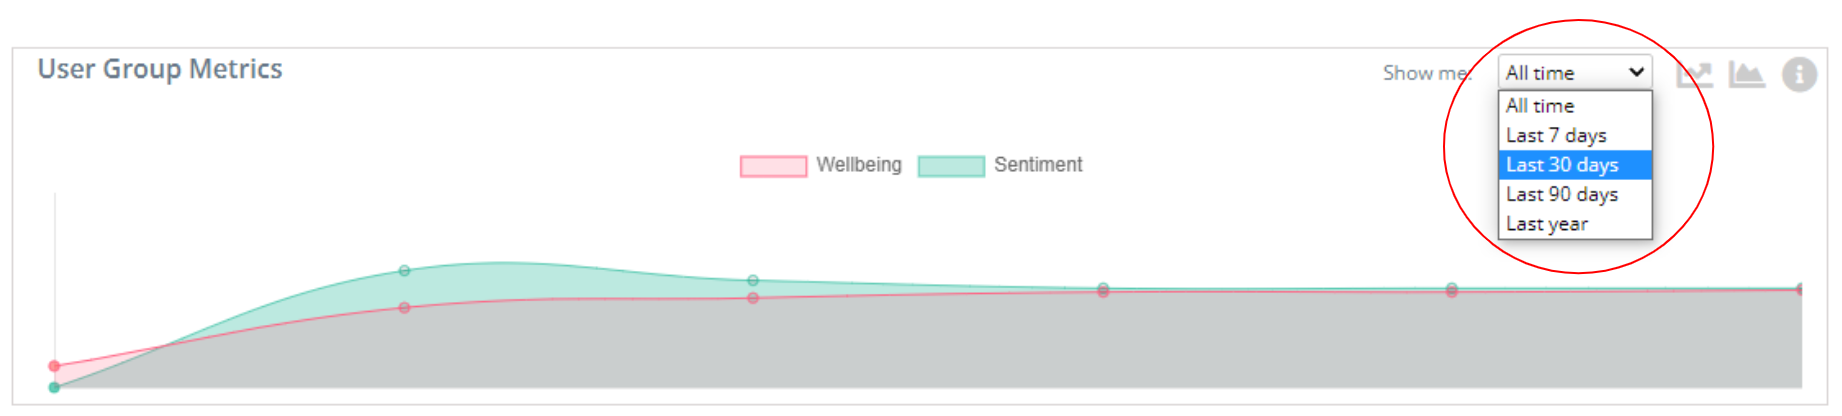
1. By time period :
2. You can add or remove data points
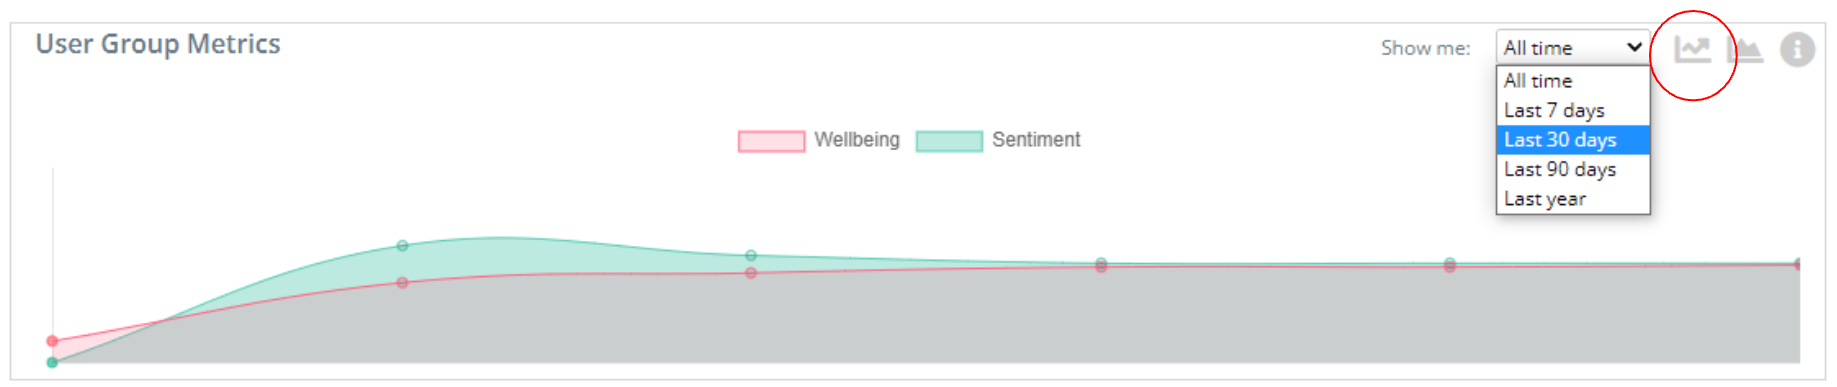
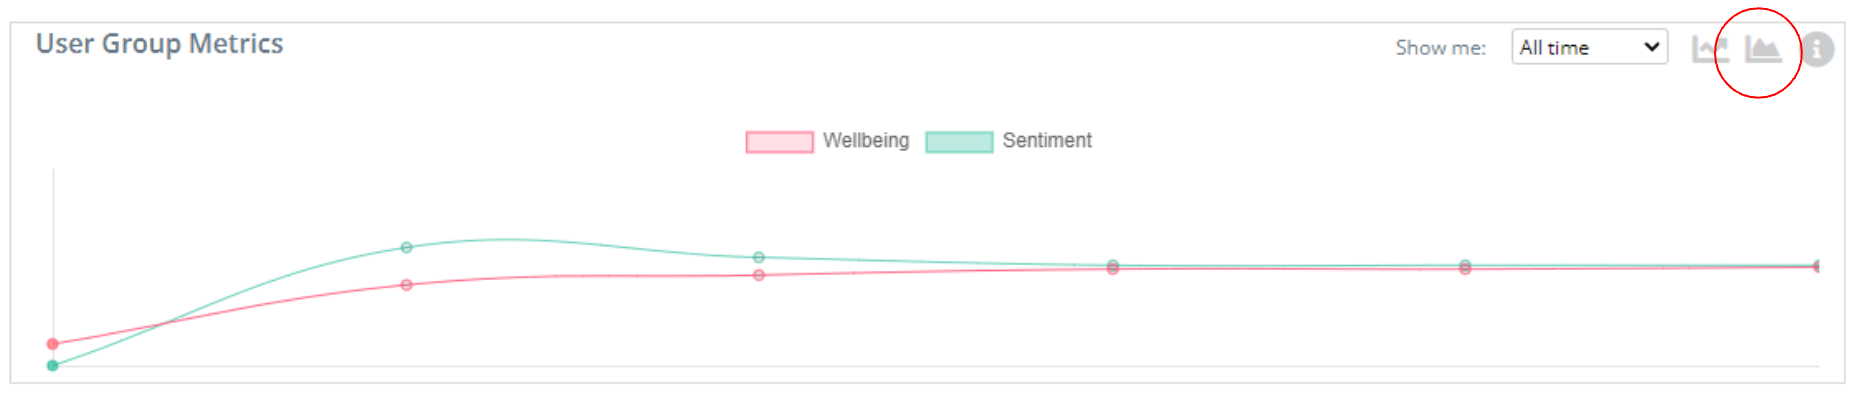
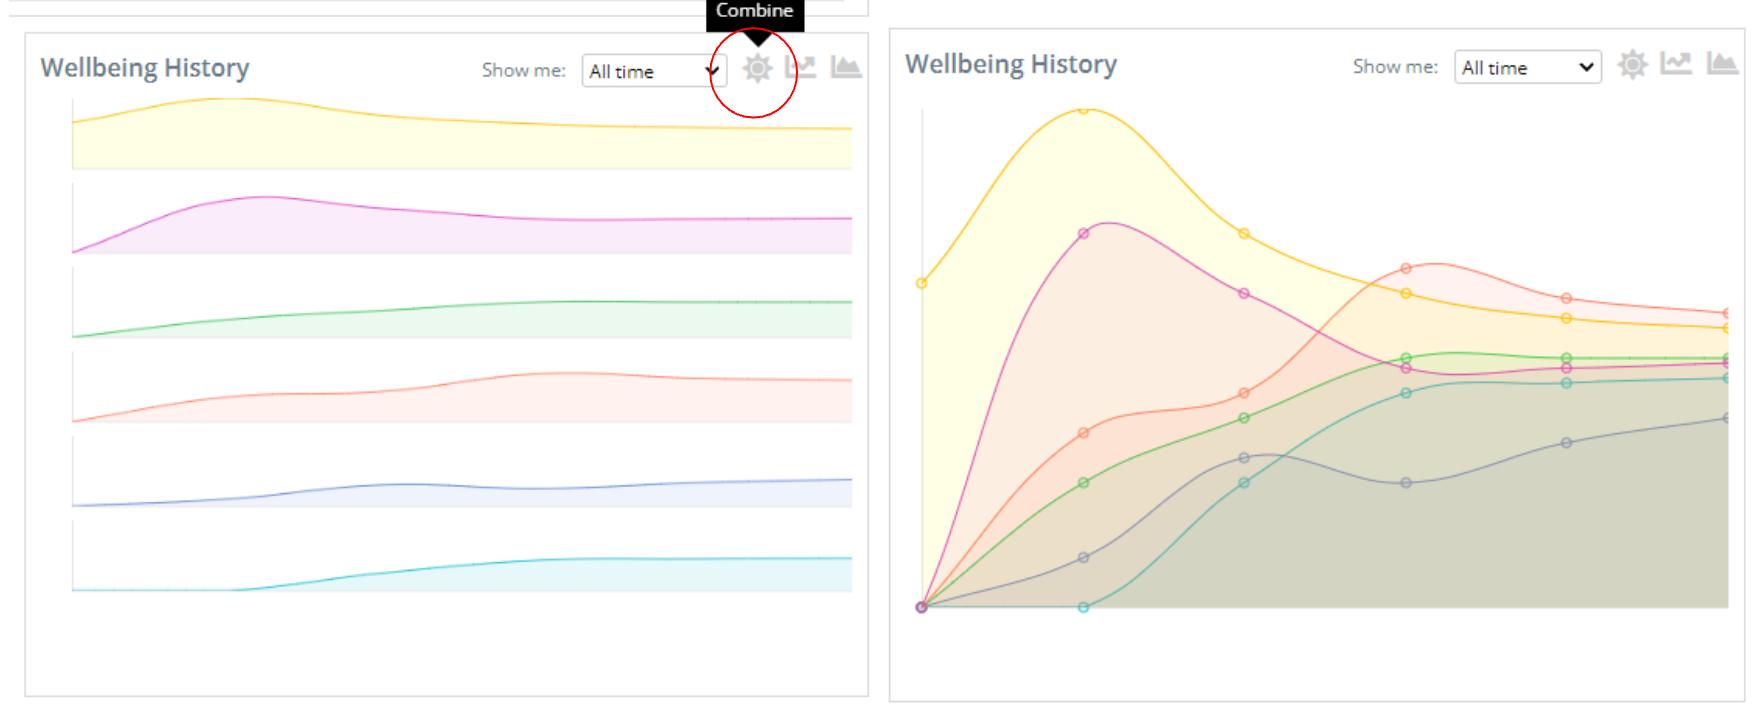
3. You can have the graph filled or unfilled.
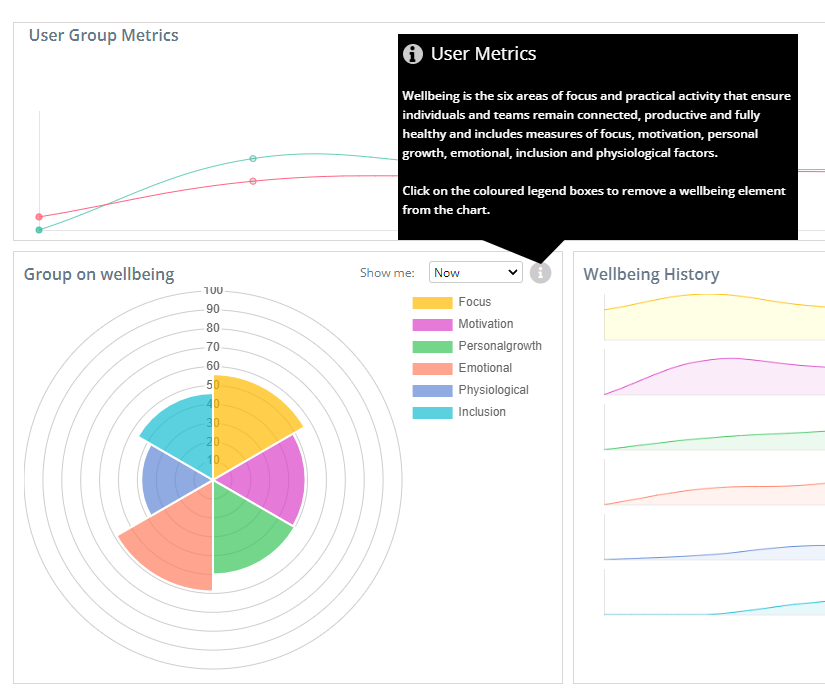
4. Some of the charts will allow you to get more information by hovering your mouse pointer over the 'i' icon:
5. Combining graphs. Some of the smaller graphs you can combine using the 'combine' icon!
Using your Watchlist
Tuddl gives you the ability to add teams to a Watchlist to keep track of any specific teams that you might be concerned about. Tuddl will also recommend teams that have wellbeing issues. You can choose whether or not to add these to your list.
On the Teams tab, you will notice that you have the ability to review wellbeing status by team:
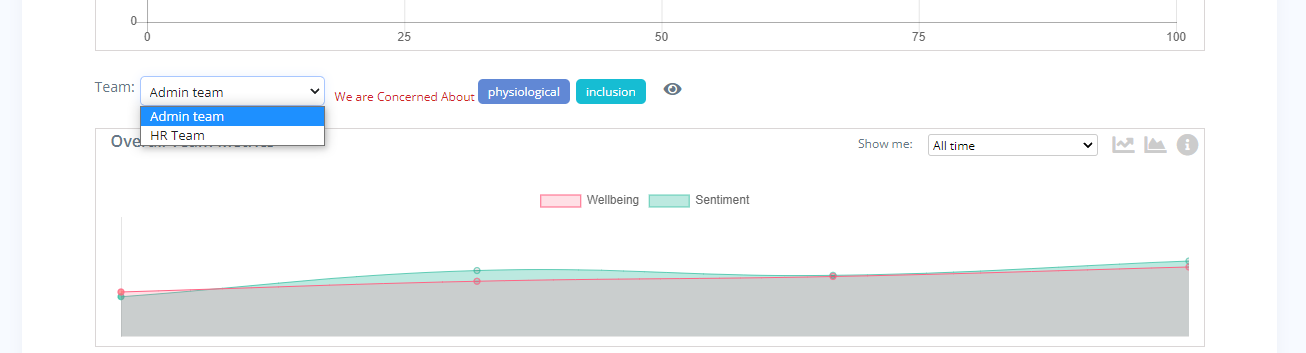
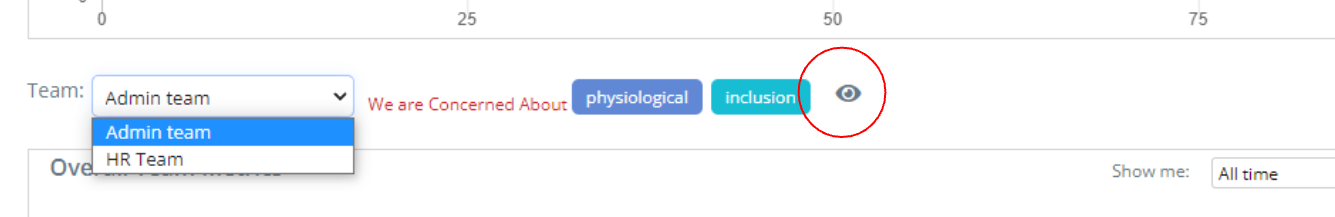
You will notice that, for this team, tuddl is pointing out that 'physiological' and 'inclusion might be an issue.
To watch a team, simply click the 'eye' icon next to the team name:
You will now be asked to choose which specific metric for this team you would like to watch:
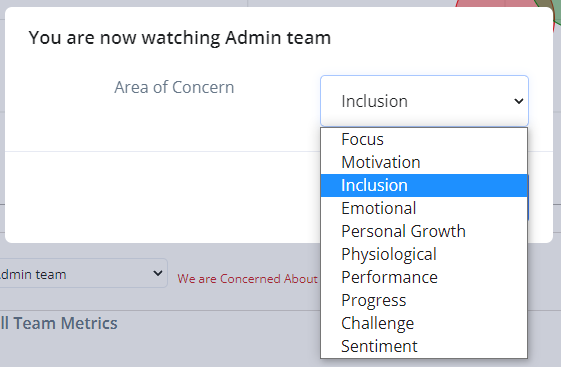
Simply click on your choice then click the Add button.
You can un-watch the team by clicking a second time. Once you have watched the team, you can review your watched teams in the 'Watchlist' Dashboard.
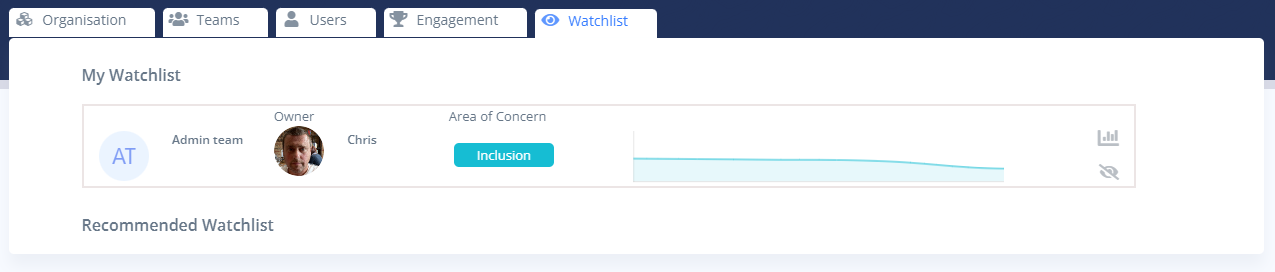
The graph icon on the right hand side will navigate to the team analytics dashboard for this team. The other 'eye' icon will remove the team from your watchlist.